
About our 2020 Impact Report
Our Impact Report looks at the amazing positive impact of secondhand trade.
Here we explain how we made the report, and the criteria behind it.
Product categories
Our report includes the below categories:
- Electronics: smartphones, tablets, laptops and televisions
- Cars
- Motorcycles
- Books
- Fashion
These categories were chosen because of their high volumes on our platforms, their tangibility, and their relevance in today’s sustainability debate.
Our markets
Our analysis was performed on a selection of geographical areas where OLX Group is active. As cars are sold on different OLX Group platforms, more countries were included.
For cars, our report includes 20 countries:
- Argentina, Bosnia & Herzegovina, Bulgaria, Chile, Colombia, Ecuador, India, Indonesia, Kazakhstan, Mexico, Peru, Poland, Portugal, Romania, Russia, South Africa, Turkey, Ukraine, Uzbekistan and the U.S. This includes the consumer brands OLX, OLX Autos, Avito, AutoTrader, Autovit, Otomoto, letgo, Standvirtual, and webuyanycar.com in the US.
For all other categories, our report includes 17 countries:
- Argentina, Bosnia & Herzegovina, Bulgaria, Colombia, Ecuador, India, Indonesia, Kazakhstan, Peru, Poland, Portugal, Romania, Russia, South Africa, Turkey, Ukraine and Uzbekistan. This includes the consumer brands OLX, letgo and Avito.
Our methodology
The research for our report was carried out by Bloom Amsterdam and Rebel Group in the Netherlands.
The goal of the analysis is to analyse the impact of selling secondhand items through platforms of OLX Group, relative to selling them firsthand. The analysis is based on the premise that for every product that is sold via a second hand platform, the life span of the product is extended. Each time a product is bought via a second hand platform, the buyer refrains from buying a new one, and extends the life span of an already existing product. Second hand platforms therefore reduce environmental impact per definition.
How is this calculated?
We calculate the total environmental impacts of producing the product. To do so, we consider all the steps in the value chain of that product, from production until end of life. We then calculate the saved environmental impacts through the lifespan expansion.
Hypothetical case:
- Over a period of three years
- Impact of production of TV: 10 kg CO2-eq
- The time a first user owns the TV: 2 years
In a world without second hand trade
- After 2 years, consumer buys a new TV (also 10 kg CO2-eq).
- Over a period of three years, we have: 10 + 5 = 15 kg CO2-eq emissions.
In a world with second hand trade
- After 2 years, the second user buys the TV and uses it for another 1 year. Over a period of three years, we have 10 kg CO2-eq emissions
- Savings: 15 – 10 = 5 kg CO2-eq emissions
- If this sale happened through OLX, we attribute these CO2-savings to OLX.
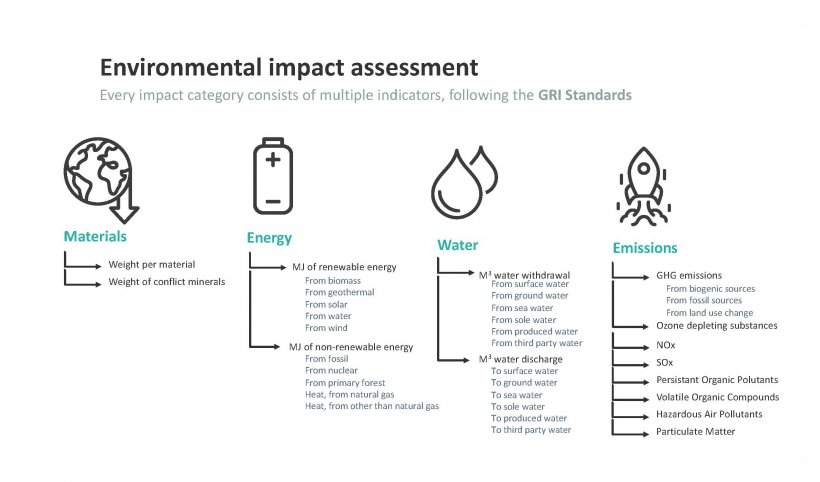
GRI Standards
The impact of all cars, motorcycles, smartphones, tablets, laptops, televisions, fashion, and books is determined for four impact categories, following the GRI Standards. The GRI Standards are structured as a set of interrelated standards. They have been developed primarily to be used together to help an organisation prepare a sustainability report which is based on the Reporting Principles and focuses on material topics. The GRI Sustainability Reporting Standards (GRI Standards) are designed to be used by organisations to report on their impacts on:
- Economy
- Society
- Environment (our focus is on environmental impact).
According to the GRI standards, organisations are not required to report on each available topic and sub-topic. Calculation methods, sources and assumptions are left open for the organisation to decide.
For this environmental impact assessment, we selected relevant quantifiable and qualitative topics and sub-topics with OLX Group to implement in the model.
The focus of the model is on the following standards within the Environmental topics:
- GRI 301: Materials
- GRI 302: Energy
- GRI 303: Water and Effluents
- GRI 305: Emissions
Other topics such as descriptions of systems do not fit within a calculating model. We have thus excluded this from the model. For the overview of chosen indicators, please see the image below.
Scope and variables
To determine the impact of the different categories, we used as much information from OLX Group platforms as possible. Below the main elements are explained:
Electronics (smartphones, laptops, tablets)
Categorisation:
We have based our data from available producer information from the four biggest brands per type of electronics (i.e. smartphones, tablets, laptops) that cover about 43% of the regional markets, the other 56% is ‘other’ which is an average of the 4 biggest models. Actual brand information was used when there was specific information available from OLX Group’s own platforms.
- Mobile phones: Apple, Samsung, Huawei, Oppo. Data from OLX Group platform and producer environmental reports.
- Tablets: Apple, Samsung, Acer, Lenovo. Producer environmental reports & market shares of tablets per country
- Laptops: Apple, HP, Dell, Lenovo. Producer environmental reports & global market shares of laptops (not available per country)
Within electronics, new models and types are released every year. To take into account the fluctuations in material use based on new models and types of product (i.e. iPhone 8 vs iPhone X, new generations of models per year) we use the average of at least five products per brand, choosing a mix of product types since 2016, varying in weight and size. To verify: Apple releases, on average, 4 upgraded models of tablets or laptops per year.
Materials used:
Based on the brand information of the producer environmental reports we know the main materials used within the different specific phones, the weights, and the packaging used.
Televisions
The factors considered were the type of television, the weights and the materials used.
Categorisation:
There are two main types of televisions, namely Plasma and LCD. Based on OLX Group sales data we were able to determine the split between these types of televisions sold over the platform. The main difference between the types of televisions are the screens used, the weights and the lifespans.
Weights:
To consider the weights, we researched the types of televisions available in 2013 to account for the first user period of seven years on average. As there are different sizes available for televisions, we took the average weight of Plasma and LCD televisions for the sizes of 45 inch up to 65 inch. The average weight of a Plasma TV is 26.5 kg and the average weight of a LCD TV is 19.4 kg. For the “others” category, we used the average of Plasma and LCD.
Materials used:
To assess the materials saved, we need to know the main components used in production of a television. As the main difference between LCD and Plasma is smaller components in wiring and screens, we do not make a distinction between the types of televisions. The main difference between LCD and Plasma is the type of screen used and the flat profile. The difference is in the smaller components used in wiring and in the screens. To assess how much material was saved, we thus only consider the main components in a television and thus do not vary between LCD and Plasma. The main materials in a television are lead, steel and plastics (source).
Vehicles
To determine the impacts of cars and motorcycles, the available information from the sales data of OLX Group platforms was considered. To account for differences in the types of cars and motorcycles sold, variations were modelled based on brands or types, weights, engine types and the materials used.
Categorisation:
Based on the available sales data information from OLX Group, the cars and motorcycles were categorised into different models to be able to account for differences.
Weights and engine types:
Based on the different model types, weights were calculated using five representative models per car and motorcycle category based on data from car and motorcycle manufacturers. The data sources used were from 2010, to account for the first user lifespan of 9 years on average. We used weighted averages in the calculations.
The type of engine in a car can have effect on the total weight of the item. From the OLX Group sales data we were able to determine the share of engine types per country. As hybrid and electric cars only amount to less than 1% of total sales, we only model petrol (68%) versus diesel (32%). For diesel cars, it is assumed that the weight is a factor 1.06 higher (this is based on EcoInvent standards as well as a ‘sample desk research’ on petrol versus diesel weights per car model). We thus model the variation in weights separately for diesel and petrol cars. For motorcycles there is less variation in engine types, thus no variation was considered.
Materials used:
Based on Ecoinvent and Lin et al, (2018) we know the split of the materials used. The main materials for cars are steel and iron (79%), aluminium (4%), and glass (4%). The main materials for motorcycles are steel and iron (71%), plastic (12%), aluminium (3%).
Books
The main variables considered to model are the weights and materials used.
Categorisation:
For books, we did not make a further split in the types of books as there was no split to be made in the sales data.
Weights:
To account for the differences in weights of books, we took the average of light-weight books (0.518 kg) and heavy-weight books (1.052 kg), amounting to 0.785 kg.
Materials used:
The materials used in books are assumed to be paper made from pulpwood, hardwood. We consider printed graphic paper as the main material.
Fashion materials
To be able to model the fashion categories, we modelled the average weight of the different fashion categories as well as the material (fibre) inputs per fashion type (i.e. % cotton, % polyester, etc. for an average suit, wedding dress, pants, dress) based on the report Environmental Improvement Potential of textiles; IMPRO Textiles of the European Commission.
To account for regionality (i.e. less heavy coats in Indonesia versus Russia), we use:
- Lower weight ranges for more tropical countries
- Upper ranges for colder countries.
When looking at all countries combined, an average fashion item has the material composition of:
- Polyester: 35%
- Cotton: 25%
- Wool: 12%
- Viscose: 10%
- Nylon: 9%
- Acrylic: 3%
- Silk: 2%
Life spans
To assess the lifespan of the products, we had to decide on the first user lifespan (i.e. how long a first user uses the product before it is sold on the platform) and the second user lifespan (i.e. how long a second user will use the product before disposal). Based this information the calculation can be made what prevented impacts can be attributed to OLX Group. For every category the lifespan is different.
There is also limited data available about how long an item is used before reselling, thus assumptions were needed, which are indicated below.
Smartphone
First user lifespan: 1.74
Second user lifespan: 3.48
Comment: Mobile phones lifespans are mostly dependent on the subscription models at different countries and are trend-sensitive (i.e. innovations for smartphones, new releases etc). We thus model regional differences for mobile phones. For regions with missing data we make an assumption based on GDP/capita. The assumption we make is that regions with similar GDP/capita will have similar lifespans; when incomes are high consumers are more prone to buy new phones, whereas when incomes are lower, the tendency to replace the phones is lower. Counterpoint, 2017. Kantar World Panel 2017. World Bank, 2018
Tablet
First user lifespan: 2.5
Second user lifespan: 5
Comment: The first user lifespan for tablets and laptops are less prone to consumer trends and more dependent on brand quality and frequency of use. We thus do not model regional differences in lifespans, but rather model differences based on brands. The first user lifespans per brand are assumed to be linked to warranty or update periods. For the total life span we double the first user lifespan. Environmental reports of producers with lifecycle assessment analyses.
Laptop
First user lifespan: 3.25
Second user lifespan: 6.5
Comment: as above.
Televisions
Total lifespan: Plasma and LCD televisions have different total lifespans before deteriorating, dependent on the usage. A Plasma TV can last up to 50,000 hours and a LCD TV up to 30,000 hours. The average amount of hours people spent watching television per country determined the total life span per country.
First user lifespan: There was only credible data available for the US, Brazil and India. To be able to vary the lifespans for the other countries, we used a factor based on GDP/capita, as it is expected that countries with similar GDP will have similar behaviour for selling or buying televisions.
Second user lifespan: The second user lifespan is the difference between the total lifespan and the first user lifespan. However, this means that the second user lifespan is more than 100% of the first user lifespan for every country. To be conservative, we thus use 100% as the total avoided impact.
Vehicles: cars and motorcycles
First user lifespan: The first user lifespan per country was measured using EU vehicle fleet data and datasets on lifespans per continent.
Total lifespan: Seeing as lifespan data is scarce, we looked into the average car age per country. This is the average age of a vehicle on the road at that moment in time. To calculate the total lifespan, we doubled the average car age.
Reuse rate: Seeing as cars and motorcycles are known to change hands more often, we cannot attribute all the additional years to OLX. We thus calculate using a reuse rate, which is the number of times a vehicle is resold during its total lifespan. We attribute only one of the rotations to OLX. We take a conservative approach for the reuse rate, with the assumption that a vehicle is reused 5 times in its lifetime on average.
Fashion
First user lifespan: 1.4
Second user lifespan: 4
Comment: A recent study of the National Institute for Consumer Research that shows the first user uses garments on average 1.4 years, and second user 4 years (meaning total life span of 5.4 years). We cannot specify any further, unfortunately, due to the lack of data/studies available. We thus use an average for all the regions and types of garments. National Institute for Consumer Research (SIFO)
Books
It is assumed that the prevented impacts of a book is simply one book. It is not expected that lifespan extension is the driver for the prevented environmental impact, but rather that when buying a book via OLX Group, it prevents having to buy a new book. We thus assume first user and second user lifespan are equal, and the prevented environmental impacts is 100% of the total impacts.
Lifecycle assumptions
To calculate the actual impacts, we modelled the different steps in the lifecycle of the product, namely: production, transport of manufacturer to country and region of sale and end of life. We do not consider the use period as these are assumed to be equal between first user and second user. Below the main assumptions are explained further.
Production
To calculate the environmental impacts of first user production we modelled the products using the Ecoinvent life cycle inventory database. Where possible, we used the end product. All assembly steps and waste streams are included in the production impacts.
For example for electronics, no end-products were available, so to calculate the environmental impacts of first user production we modelled the different components (e.g. circuit board, battery etc) individually using the Ecoinvent life cycle inventory database. We also included the assembly steps (i.e. the added step of sheet rolling of aluminum for electronics or bleaching/ dyeing the fibres for fashion) and took into account the packaging (plastic and carton/fibres) based on weights and materials reported by producers.
Transport
To be able to model the transportation impact, we included: transport from manufacturing site to the individual countries, as well as the transport within the receiving country where the actual sales were (i.e. regions).
Transport distance manufacturer to country of sale
- For mobile phones and tablets, the main assembly for final production is done in Zengzhou, China (based on information on the supply chain of Apple, as the market leader). Since smartphones and tablets are relatively light and have a high turnover, they are most often transported by air freight from the airport in the province Zhengzhou to the countries of destination.
- For laptops, the main assembly for final production is done in Suzhou, China, based on Apple information. From there, they are transported by sea freight to the destination countries. Seeing as there can be multiple sea freight routes (depending which canal to take, for example, we have opted for the shortest routes.
For televisions, the main manufacturing locations are Tianjin, China and Suwon, South Korea, based on manufacturer information. The distance is measured over sea, as it is assumed televisions are transported using sea freight.
- For cars the production locations were based on global production data for final assembly of cars, using International Organisation of Motor Vehicle Manufacturers. We used the data from 2012, based on the average first user lifespan. For motorcycles we used the global production data of motorcycles for final assembly. Since vehicles are heavy and difficult to transport, we assume countries import cars from nearby producing countries. For example, Poland will import its cars from Germany as it is closest, rather than importing from China or USA. When a country is within the same continent and connected by land, we assume it is transported by lorry overland. If there is no land connection, we assume sea freight.
- For fashion there are many production locations: 36% of production occurs in China, 33% in EU and the remaining in Bangladesh, Vietnam, India, Turkey, Hong Kong, Indonesia, Cambodia and USA, based on the World Trade Statistical Review 2019 by WTO. We modeled the main fashion production cities based on qualitative in these countries and calculated the sea freight distance from these cities to the countries of sale.
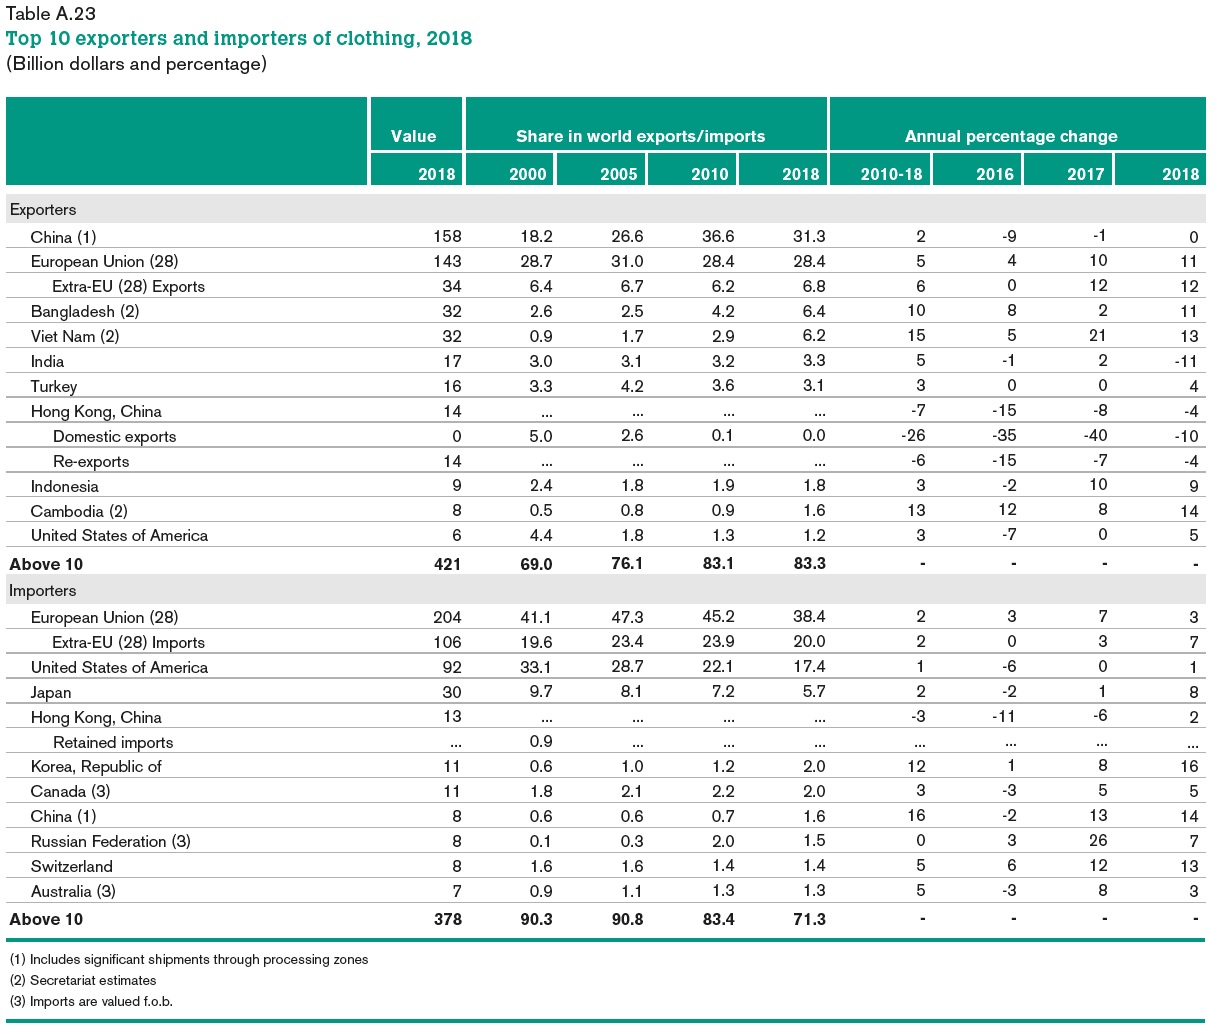
- For books, it is assumed that production locations are more regional due to printing houses often being located in the country itself. To be able to account for transport, we used the internal distance of a country between producer to consumer. It is assumed all internal distance travelled is done by lorry.
Transport distance country of sale to region of sale
To calculate the in-land transport to the specific regions of sales, we calculated the distances of the main ports per country to the main cities within each region. For the countries that are landlocked, we used the closest harbour in the neighbouring country. We assume the in-land transport is done by lorry.
End of life
For end of life we looked at the means of disposal per country. The type of disposal vary based on the type of waste stream. The different means of disposal are further described below:
Electronics:
For electronics the Global E-waste Statistics Partnership defined the different ways of disposing e-waste, namely either through shredding, mechanical treatment, incineration, landfill, material recovery, refurbishing, open burning or melting, acid leaching and dumping. Based on the country sheets of the Global E-waste Program, ITO and qualitative data of different nations we have defined the percentage of e-waste landfilled vs recycled vs dumped per country.
Cars and motorcycles:
For cars and motorcycles, a split was made per country using three routes for end of life disposal, namely manual dismantling and shredding, manual dismantling where spare parts are landfilled, or full-vehicle dumping. For Europe the statistics were available through the EU database. For the other countries we used data reports and looked at waste statistics per country to establish the split between the three routes.
Fashion:
Based on the global report by the Ellen McArthur Foundation, we know the global disposal rates, where 25% of disposed fashion is collected for recycling and 75% is incinerated/landfilled. For low income countries, these rates are 10% collection and 90% landfilled/incinerated. For European countries we used a scientific report of the Journal of Cleaner Production to assess that 20% is collected and 80% is incinerated or landfilled.
Books:
There are good recycling initiatives in place for printed paper. When paper does not get recycled, it usually ends up in municipal waste, where it either gets landfilled or incinerated for energy recovery. The recycling rates are taken from Eurostat for European countries. For the remaining countries, the regional CEPI recycling rate was used. To determine the level of incineration versus landfilling, country reports were used.
Copyright: OLX Group 22 March 2021. All rights reserved.